Stock prices move in patterns, so studying these patterns through Charts assist traders in making informed decisions when investing or Trading in the markets. As a result, Stock charts are extremely useful for trading. Through this Post, we will try to explain about most important Chart Types used in Stock Market.
What is a Stock Chart?
A chart is a graphical representation of a Stock’s price and volume changes over a given time period. The time period is represented by the X-axis, and the price movement is represented by the Y-axis in the graphical chart. The time duration can range from a few minutes to months or even years. They show historical price, volume, and time intervals in a graphical format.
You can Use Popular Charting Site TRADING VIEW for seeing charts of different Stocks.
Important Chart Types
Charting has evolved from handmade charts to charts built on software which have hundreds of tools and indicators. There are multiple chart types which are used in the stock market for technical analysis. Here in this post we will try to explain the 5 most popular types of Charts used in the Stock Market.
1. Line Charts
A line chart is drawn by connecting the closing price of a stock or index over a period of time.
It is one of the simplest forms of Stock charts. Each closing price point is represented by a dot. To create the graphical representation, all of the dots are connected by lines.
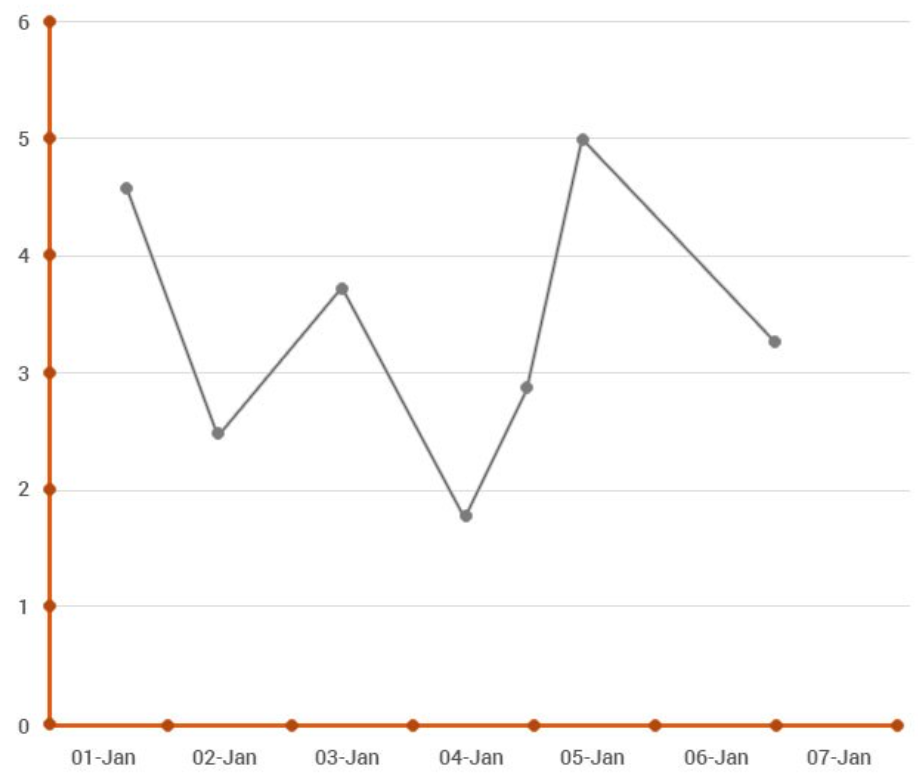
In the above chart, the X-axis represents the Time Period while the Y-axis represents the Stock Price. Line chart analysis is useful for Mid-term and Long-term traders or investors. It is not very useful for short term traders.
2. Bar Charts
Bar Chart used to be a Popular Chart Type. Even today, some institutional investors use this form of the chart pattern. Using bars is an improvement over using a line chart because it allows us to plot more useful data on the chart.
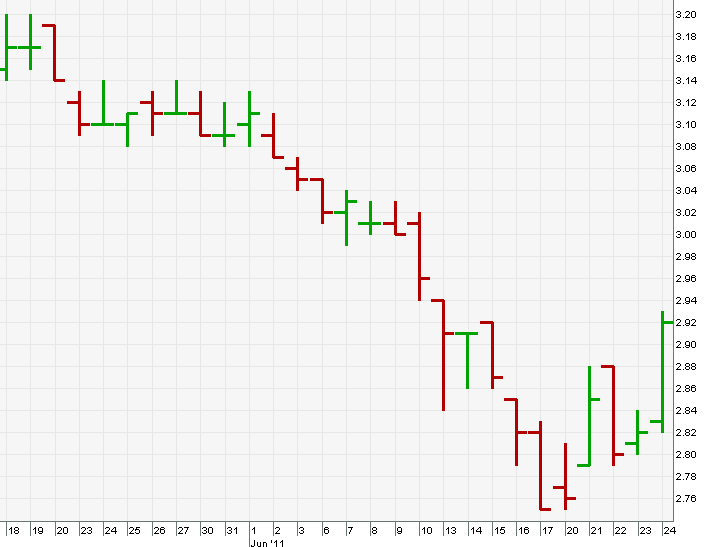
Each bar represents a trading period and includes the price Open, High, Low, and Close. If The close is above the open, then it is a Green Bar (indicating upside movement). If the close is below open, then it is a Red Bar (indicating downside movement).
The top part of the vertical line represents the highest price at which the stock had traded during the day. Similarly, the lower part represents the lowest traded price.
2. Candlestick Charts
These are Japanese Chart Patterns and these are Named Candlesticks because they look like candlesticks with a wick and the main body. These are the most commonly used Chart types in Stock Market nowadays.
These charts contain the same four pieces of data – open, high, low, and close.
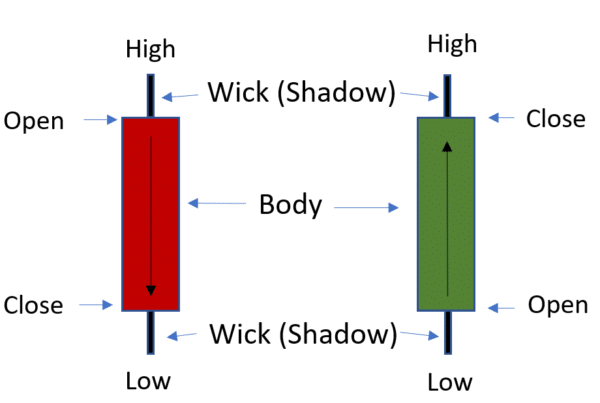
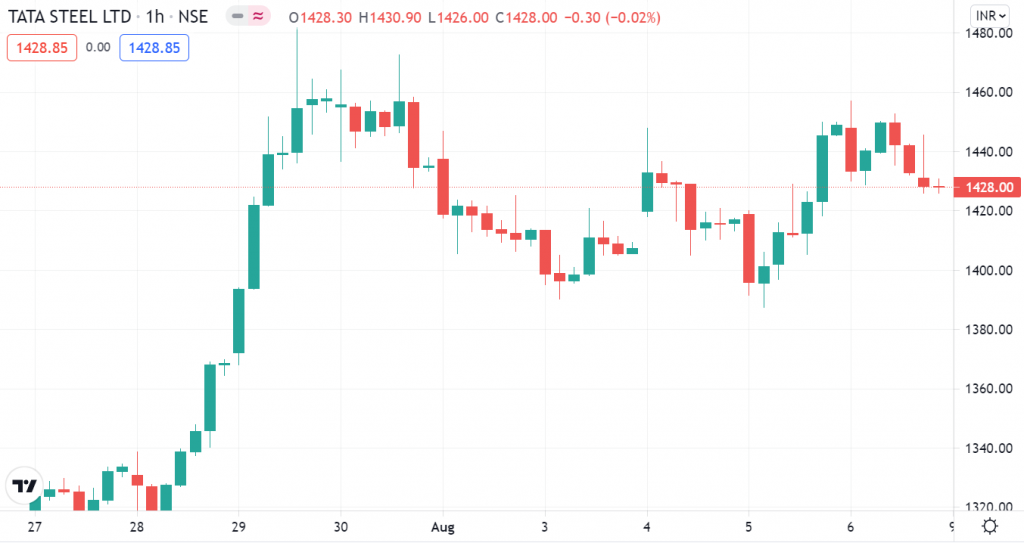
In addition, the candlesticks come in different colours based on the Price Movements. A falling candlestick is generally represented by a Red body while a rising candlestick is represented by a Green body.
Since, These Chart Types offer a great deal of information in a very precise manner. Candlestick charts are the most suitable chart type for intraday, short term as well as long term traders.
3. Heiken-Ashi Charts
It is a Japanese Chart form which is a better Charting System. The Heiken-Ashi Chart helps in following the market trends. In this Chart Pattern, During an uptrend a series of green candles are made and during downtrend a series of Red Candles are displayed.
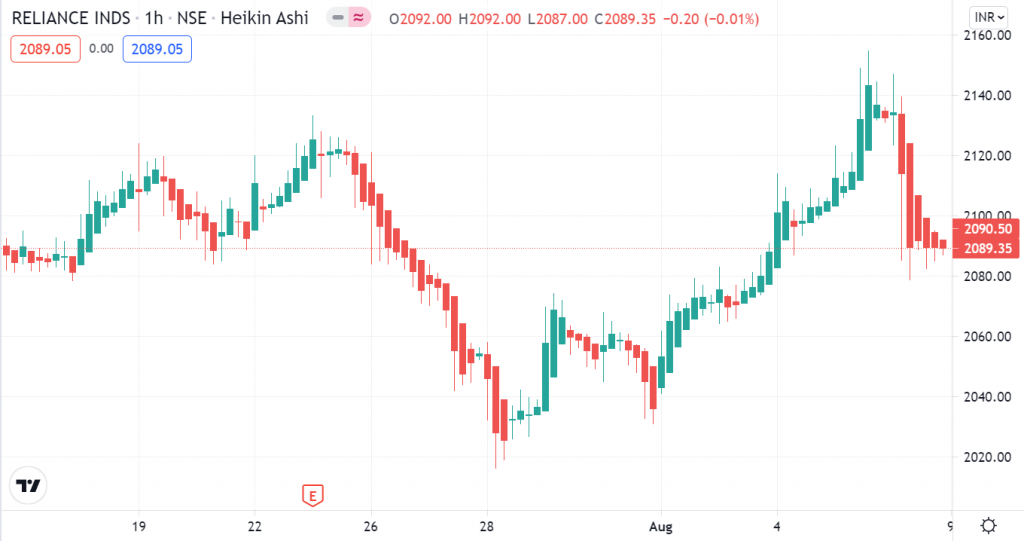
This type of Chart is Good for Mid-Term and Long-Term Traders for Trend Following. However, this chart has a serious limitation as it misses out on Highs and lows.
A Heiken-Ashi Chart does not show Gaps. The Heiken-Ashi chart is not ideal for intraday traders.
5. Renko Charts
Renko charts are a type of chart that only shows price movement. Renko comes from the Japanese word renga, which means “brick.”
Renko charts are one of the major types of charts used in technical analysis. They focus solely on price changes and use price bricks to represent a fixed price move. They filter out minor price movements, making it easier to identify price trends. This feature also improves the Uniformity of the chart’s appearance.
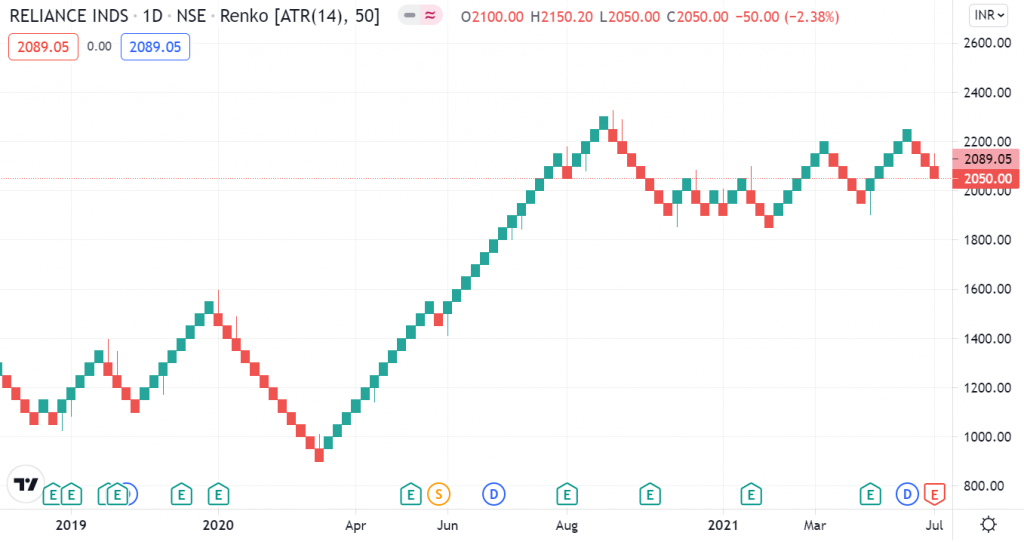
The Renko charts depict a sharp trend in price. So, A Renko chart technical analysis is very effective for identifying support and resistance levels. When the trend changes and the bricks alternate colours, you get a trading signal.
Conclusion
Among all the Chart Types, Candlestick Charts are Most Commonly used and recommended for all. As a stock market trader, you must be able to read a chart and understand the information that it represents. This can assist you in identifying price patterns in the stock market and making more informed trading decisions.
Read: How to Select Stocks for Investment? Basics of Fundamental Analysis